Profile a Parser Implementation in Rust
In 2025, I developed cgrammar, a comprehensive ISO C23 grammar parser in Rust, leveraging the chumsky parser combinator library. While originally designed for my internal projects, I open-sourced it as a general-purpose C parser. This library is distinguished by its isomorphic approach to C23 attributes. By exposing C syntax elements as reusable parser combinators, it allows for granular parsing of attribute contents consistent with the language’s core grammar.
When I created the parser, I deliberately set performance aside as a consideration to focus exclusively on robustness and the complexities of the C language. Later, however, I wanted to understand the parser’s runtime characteristics, so I decided to profile the library and share my findings in this blog post.
Here are the key takeaways:
Rc::cloneis heavier than anticipated.- Parser combinators are hard to profile due to their layered abstractions. However, optimizations outside the combinators can still result in significant performance gains.
Prepare the Benchmark
Profiling the parser required a large C codebase. Luckily, I already had a perfect candidate: the parser’s own test cases11.I will give credits to the cake project where the test cases are originally sourced from.. Once preprocessed, this resulted in about 1.2 million lines of C code (or 20k lines stripped of comments and whitespace).
The benchmark runner implementation was straightforward: simply iterate through a directory and parse the files one by one. I placed this logic in benches/bench.rs and added the following configuration to Cargo.toml. This setup ensures that Cargo uses the benchmark profile during execution, i.e., running in release mode with debug symbols. And I turned off the default benchmark harness to allow for my own main function.
[profile.bench]
debug = true

[[bench]]
name = "bench"
harness = false
Profile with samply
I choose the samply profiler, a general-purpose sampling profiler. It uses the Firefox profiler as its UI, which I find most user-friendly among the available options.
Running the profiler is as simple as prefixing the benchmark command with samply record:
samply record cargo benchAfter the benchmark completes, samply will open the Firefox profiler UI in your default browser, displaying the collected profiling data, including call trees and flame graphs.
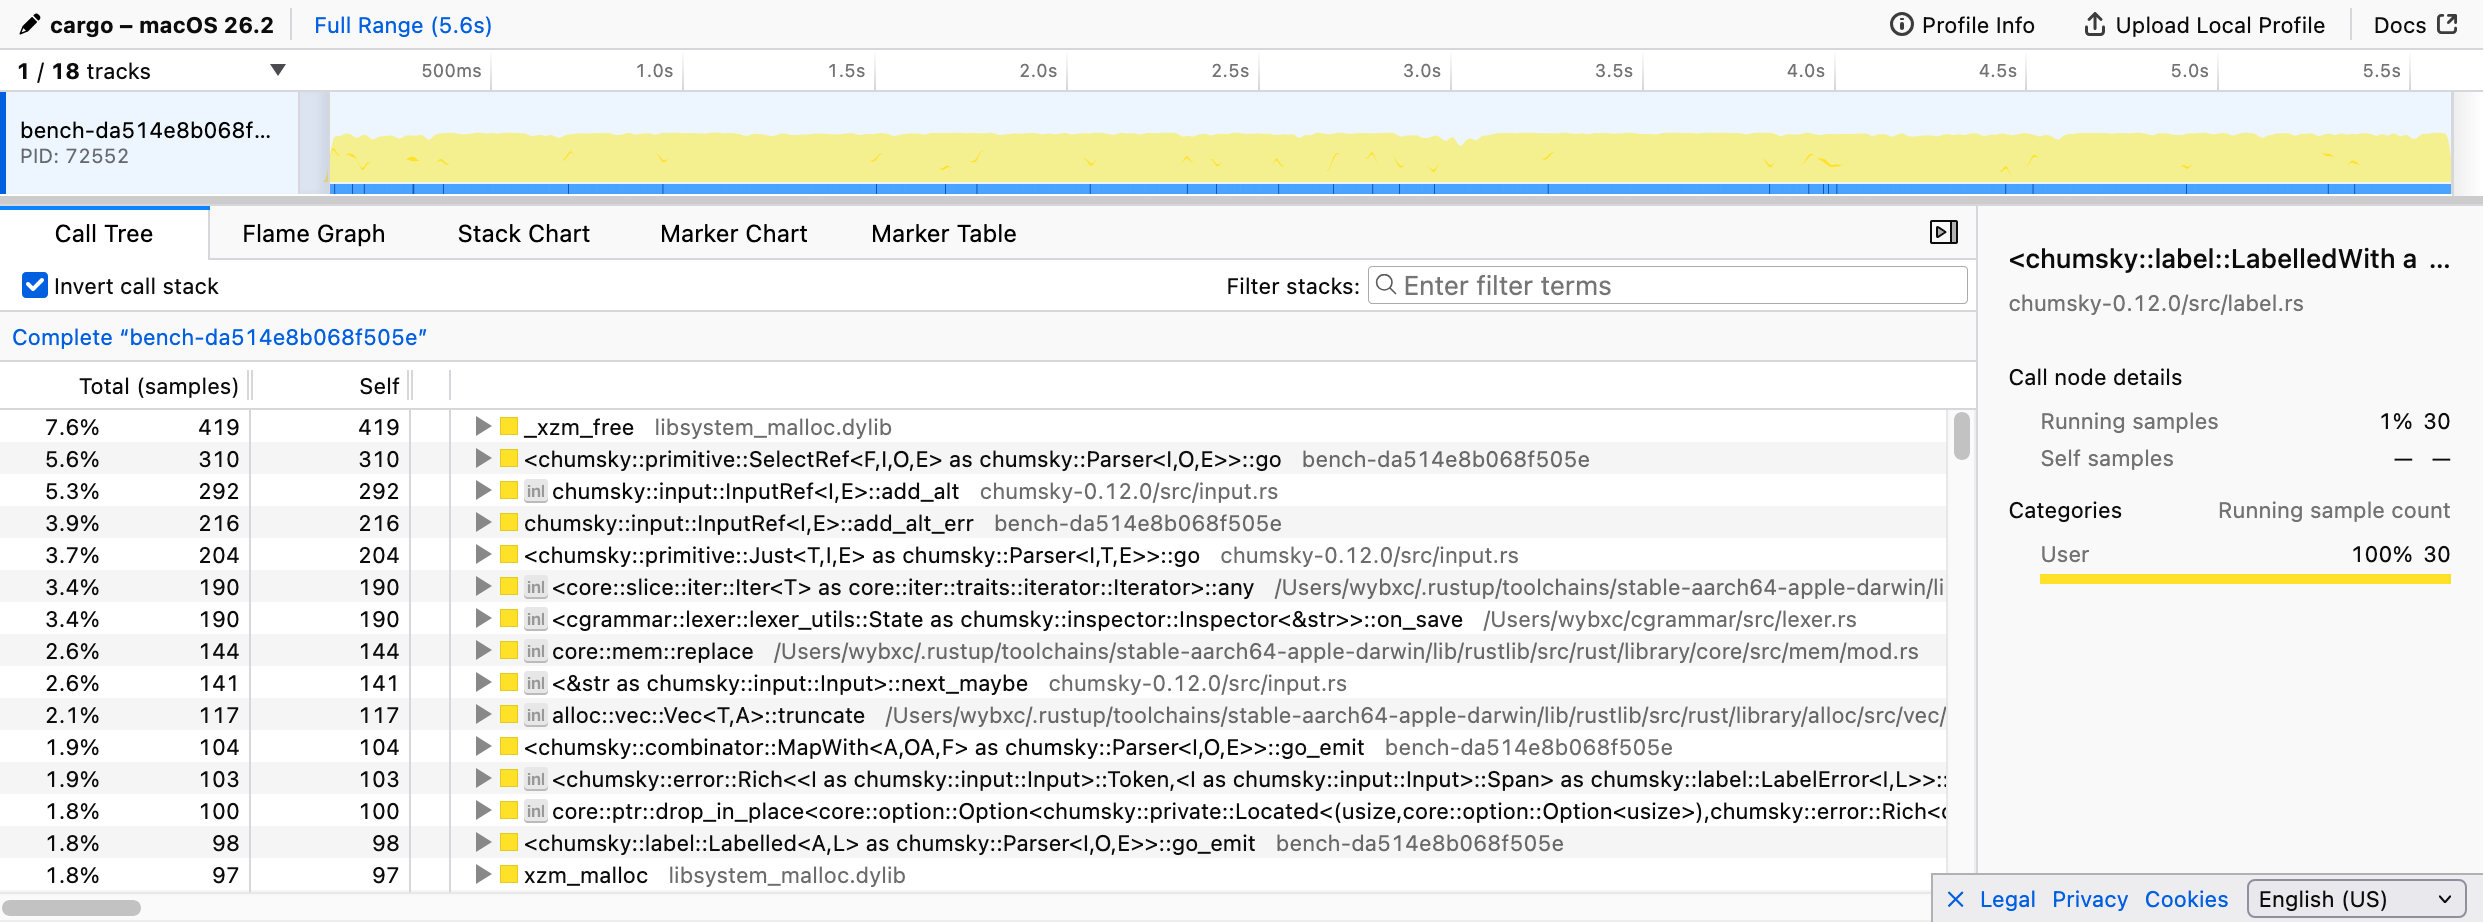
As expected, the parsing logic dominated the execution time. However, drilling down proved difficult: most function calls appeared as generic <chumsky::... as chumsky::Parser<I, O, E>>::go> signatures, making it impossible to identify which specific combinators were the bottlenecks.
This is largely the price of abstraction. Once parser combinators are composed, their high-level structure is erased at runtime, preventing a non-invasive profiler like samply from seeing through the layers.
I was nearly ready to give up on samply, but I decided to inspect the call tree one last time. That’s when I noticed something odd: a massive amount of time, over 20% of the total execution, was being consumed by Cell::get, triggered primarily by Rc::clone and Rc::drop22.You may not find then in the previous screenshot because I had already optimized the code before taking it..
I was floored. I never expected Rc operations to be such a heavy burden. So, what exactly was going on?
Understanding the Overhead
A look at the call tree revealed the culprit: the extensive Rc::clone and Rc::drop calls were tied directly to state management in the lexer and parser.
To understand why, here is a bit of background on cgrammar. The lexer consumes preprocessed C code, where the preprocessor inserts line directives to map back to the original source file. To report errors accurately, the lexer must track the current filename and line number, updating them whenever it encounters these directives. However, because the parser supports backtracking, the lexer needs to be able to snapshot and restore its state at any point. I implemented this using chumsky’s stateful parsing features, specifically via the Inspector trait and a custom Checkpoint type, where chumsky can save the current state into a Checkpoint and restore it later as needed.
This is where Rc entered the picture. Since the filename is part of the lexer state, I wrapped it in an Rc<str>. My logic was that deep-copying the string string data upon every backtrack would be prohibitively expensive. The use of Rc makes the lexer state a cheap-to-clone type, and I simply use the state itself as the Checkpoint type. While I was right about avoiding deep copies, I failed to anticipate that the state would be cloned so frequently that the reference counting overhead itself would become a bottleneck.
To confirm this suspicion, I instrumented the lexer to count the clones. The results were staggering: while parsing 1.2 million lines of C code, the lexer state was cloned over 400 million times.
It turns out Rc itself isn’t slow; the average Rc::clone took about 6ns, which is typical for an L2 cache access. There were no major cache-miss penalties; the problem was simply that my design triggered an excessive volume of operations. The parser state, which tracks context-sensitive constructs like typedefs, suffered from the same issue (albeit with about 20% of the clone volume).
The solution is clear: I need to eliminate Rc from the state entirely. By redesigning the state, I can ensure that checkpoints are Copy types, making save/restore operations trivial without any indirect memory access.
Goodbye, Reference Counting
Since the lexer and parser states utilize different structures, I adopted two distinct strategies to eliminate Rc overhead.
For the lexer, the only field utilizing Rc was the filename. I decided to replace this with a “global string pool”. Well, to be honest, I simply leak the filename strings to obtain a &'static str, which implements Copy.
Don’t panic at the mention of memory leaks! If data is stored in a pool that persists for the entire program’s duration, it is effectively leaked memory anyway. Since the number of source files is practically bounded and small, this is an acceptable trade-off to completely bypass reference counting.
The parser state is much larger and more complex, so it can’t simply implement Copy. Instead, I used a slab allocator to manage snapshots of the parser state.
The key insight here is that while the parser saves and restores state frequently, the number of unique state versions is relatively low (typically just hundreds per file). By storing the actual state data in a slab, checkpoints can be represented by simple integer indices, which are significantly cheaper than Rc pointers. When I need to mutate the state, I clone it into a new slab entry to ensure previous checkpoints remain valid.
This design trades memory usage for performance, as I defer the cleanup of old states until parsing is complete. However, this isn’t a major issue; I can still use Rc inside the state structure to share data between versions, and the resulting speed gain is well worth the extra memory footprint.
With these changes, I re-ran the benchmarks and saw a 14% overall speedup. That is massive, especially considering I didn’t touch the actual parsing logic at all.
The Lessons Learned
In Rust, Rc is often considered the representative of cheap cloning types, and previously I thought I could clone it liberally without giving performance a second thought. However, in this specific case, the sheer frequency of these clones turned out to be a major bottleneck.
The lesson here is: always consider the volume of operations, not just their individual cost. When you are dealing with millions of operations, the overhead from memory traffic (and even cache-hit access!) can accumulate into a significant performance penalty.
Wrestling with these Rc issues actually sidetracked me from my original goal: finding an effective way to profile parser combinators. That is a rabbit hole for another day, perhaps I’ll do some proper research and dedicate a future blog post to it?